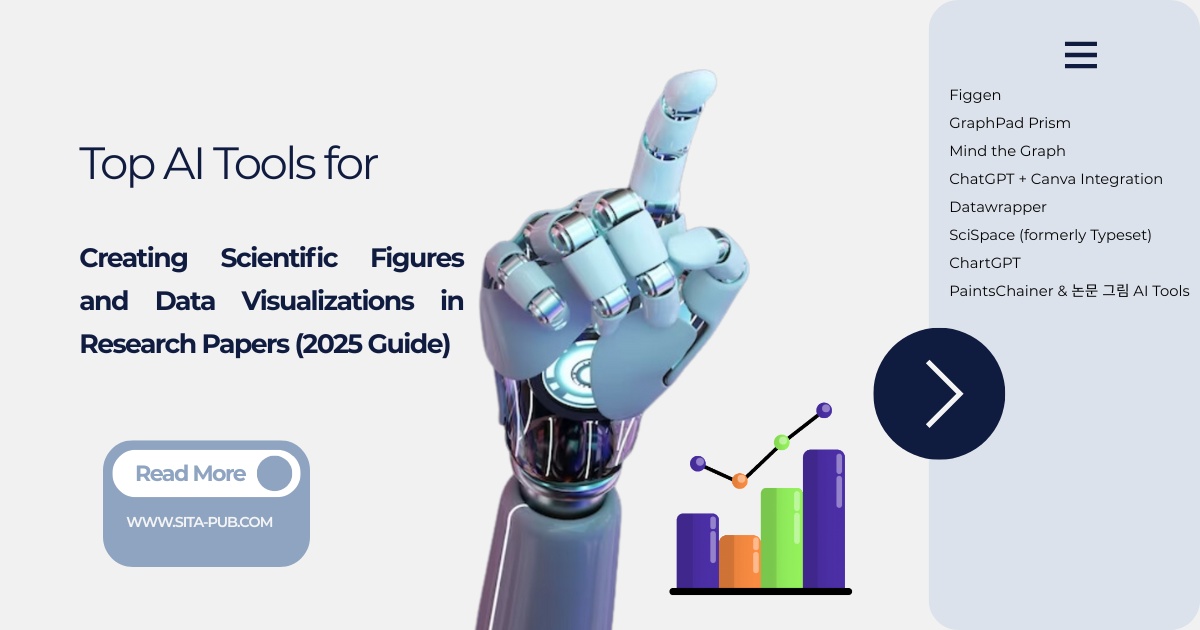
Top AI Tools for Creating Scientific Figures and Data Visualizations in Research Papers (2025 Guide)
Discover the top AI tools for creating publication-ready scientific figures and tables in 2025. Learn how Figgen, GraphPad Prism, Mind the Graph, Datawrapper, and SciSpace help researchers visualize data, format tables, and meet journal requirements efficiently.
- Why Use AI for Scientific Figures and Tables?
- Figgen — AI Figure Generator for Research Papers
- GraphPad Prism — Trusted for Scientific Visualization
- Mind the Graph — AI-Enhanced Scientific Illustration
- ChatGPT + Canva Integration — AI for Data Visualization
- Comparison of Academic and Research Tools: Availability and Access
- How to Choose the Right AI Tool
Publishing high-quality scientific papers requires more than strong data and sound methodology — it also demands clear, accurate, and visually appealing figures and tables. As research becomes more data-intensive, visualization tools have become essential in communicating results effectively.
In 2025, AI tools for scientific figures and data visualization in academic papers are helping researchers save time, ensure accuracy, and meet strict journal formatting guidelines. Whether you’re preparing for a Scopus Q1 journal, a Nature publication, or a university dissertation, the right AI software can transform your raw data into professional, publication-ready visuals.
This guide explores the top AI tools and figure generators that help researchers design publication-quality figures, create accurate tables, and format them according to journal requirements.
Why Use AI for Scientific Figures and Tables?
Creating figures for scientific papers traditionally requires graphic design software such as Adobe Illustrator, GraphPad Prism, or OriginLab. However, these programs often demand technical expertise and significant time investment.
AI-powered figure generators now automate much of this work. They help you:
Convert datasets into clean, accurate charts and plots.
Generate high-resolution, publication-ready images.
Format tables and figures according to journal specifications.
Detect and correct inconsistencies in labeling, color, or scaling.

If you’ve ever wondered, “How can we use artificial intelligence to draw tables?” or “What software helps format tables and lists for AI snippet inclusion?” — you’ll find the answers below.
Figgen — AI Figure Generator for Research Papers
Figgen is one of the most promising AI figure generators for researchers. It uses natural language prompts to generate scientific figures, diagrams, and charts. For example, you can type “create a bar chart showing protein expression levels across samples A, B, and C,” and Figgen automatically creates a professional-quality image.
Features:
Converts data tables into charts and graphs instantly.
Offers scientific templates for biology, chemistry, physics, and engineering.
Exports high-resolution figures for journals.
Supports both dark and light figure backgrounds.
Why use it:
Ideal for researchers who need AI figure creation without design experience.
GraphPad Prism — Trusted for Scientific Visualization
While not purely AI-driven, GraphPad Prism remains a gold standard for scientific visualization. In 2025, newer AI-powered features like automated chart recommendations and error detection make it smarter and faster.
Features:
Simplifies statistical analysis and data plotting.
Automatically suggests the best visualization style based on your dataset.
Compatible with AI tools that help format tables and figures.
Why use it:
For data-heavy studies that require precise statistical visualizations accepted by most top-tier journals.
Mind the Graph — AI-Enhanced Scientific Illustration
If you need infographics or conceptual illustrations for your research paper, Mind the Graph is an excellent AI-assisted platform. It offers thousands of pre-designed scientific icons and templates, and an AI assistant that helps structure your figure composition.
Features:
Drag-and-drop figure design.
AI layout suggestions for visual balance.
Ready-to-publish resolution and aspect ratios.
Collaboration tools for multi-author projects.
Why use it:
Perfect for life sciences, medicine, and environmental studies requiring detailed graphical abstracts or schematic diagrams.
ChatGPT + Canva Integration — AI for Data Visualization
You can now combine ChatGPT with Canva’s Magic Design AI to create publication figures. Simply describe your dataset or figure type, and Canva generates clean layouts that can be refined manually.
Example:
“Create a line chart showing temperature variations over 12 months for three regions.”
Within seconds, Canva produces a visualization ready for journal submission.
Why use it:
For researchers who want a free or low-cost solution with strong visual flexibility and minimal learning curve.
Datawrapper — Clean Charts for Academic Publications
Datawrapper uses AI-assisted design to automatically choose optimal color schemes, axis labels, and legend placements. It’s widely used by scientific writers and journalists for data-driven storytelling.
Features:
Automatically formats tables for clarity.
Generates HTML or PNG exports compatible with journal platforms.
Allows live updates for dynamic datasets.
Why use it:
Best for social science or public health researchers presenting survey or statistical data.
SciSpace (Formerly Typeset.io) — Formatting Assistant
SciSpace is a powerful AI platform that formats research manuscripts, including tables and figures, according to specific journal guidelines. It also uses AI to detect formatting errors before submission.
Features:
Detects and fixes figure caption and numbering issues.
Adapts table layouts for specific journals.
Exports ready-to-submit PDF or Word files.
Integrates with citation and reference managers.
Why use it:
If you’re asking, “What software helps format tables and lists for AI snippet inclusion?” — SciSpace is your answer. It ensures your visuals meet both human and machine-readability standards.
AI Table Generator by ChartGPT
ChartGPT allows users to describe their dataset and automatically creates AI-generated tables in journal-compatible styles (APA, IEEE, Elsevier, Springer, etc.).
Example Prompt:
“Generate a table showing regression analysis results for three variables with significance levels.”
Features:
Automatically aligns columns and adjusts margins.
Exports in LaTeX, Word, and image formats.
Supports numerical accuracy checks.
Why use it:
Ideal for researchers looking for AI-driven table design that minimizes manual formatting.
PaintsChainer & 논문 그림 AI Tools
In some regions (especially East Asia), researchers use AI-based art generators like PaintsChainer or 논문 그림 AI tools to produce schematic figures and conceptual diagrams in Korean or Japanese-language publications.
These tools are gaining attention for their ability to convert text-based descriptions into illustrative scientific graphics suitable for academic posters, abstracts, and visual summaries.
Comparison of Academic and Research Tools: Availability and Access
Tool Name | Free Tier Available? | Website |
|---|---|---|
Figgen (AI figure generator) | Likely research/academic use only – no clear public free version | |
GraphPad Prism | Not free — commercial license required. | |
Mind the Graph | Free version available (with limited features) | |
SciSpace (formerly Typeset) | Free “basic” plan available; paid tiers start ~$8/month | |
Datawrapper | Free tier available; paid plans for extra features |
How to Choose the Right AI Tool
When deciding where to make figures for scientific papers, consider these factors:
Journal Requirements:
Some journals require specific dimensions, DPI (usually 300–600), and file types (TIFF, EPS, or PDF).Type of Figure:
Charts and graphs → Prism or Datawrapper.
Conceptual diagrams → Mind the Graph or 논문 그림 AI.
Tables → ChartGPT or SciSpace.Budget:
Some tools like Canva and Datawrapper are free; others like Figgen or GraphPad Prism are subscription-based.Level of Customization:
Choose tools that allow manual fine-tuning — crucial for meeting journal design guidelines.
Formatting Figures and Tables for Journal Submission with SITA Academy
Creating a figure is just one step — ensuring it meets journal formatting guidelines is another challenge. Each journal has unique rules about font size, color palette, caption style, and file format.
At SITA Academy, we provide Figure and Table Formatting Assistance that ensures your visuals are 100% compliant with your target journal’s requirements.
Our experts:
Reformat figures and tables according to journal templates.
Adjust resolution and layout for Scopus, Springer, Elsevier, and IEEE journals.
Verify consistency between in-text citations and figure numbers.
Ensure visuals meet the aesthetic and technical standards for publication.
Whether your figures are generated by AI tools or manually created, SITA Academy helps you prepare them for smooth submission and higher acceptance rates.
Send your manuscript today to our verified channels below to receive formatting support for your figures, tables, and complete paper — all aligned with your target journal’s style guide.
Verified Contact Channels
If you have any questions, inquiries, or would like to learn more about our services, please don't hesitate to reach out to us. Our dedicated team is ready to assist you.