Creating a Graphical Abstract for Journal Submission + Examples
Do you want to submit your paper to a journal that requires a graphical abstract? Learn what a graphical abstract is, which journals ask for it, and how to create one effectively using top tools and clear design tips—all explained simply for researchers.
Publishing your research in a reputable academic journal involves more than just writing a strong manuscript—it also requires presenting your work in a way that grabs attention quickly. One powerful tool to achieve this is the graphical abstract.
In this blog post, we’ll explain what a graphical abstract is, which journals require it, the benefits of including one, what makes a good graphical abstract, and the best tools to design one—even if you have no design experience.
What Is a Graphical Abstract?
A graphical abstract is a single, concise visual summary of the main findings of a research paper. It typically includes diagrams, illustrations, or conceptual graphics that summarize the essence of the article in a way that's quick and easy to understand.
Unlike the traditional text-based abstract, the graphical abstract is meant to visually communicate your research—helping readers grasp your main idea at a glance. It is not a figure from your results section, but rather a simplified conceptual overview designed to stand alone.
Think of it as a visual elevator pitch for your research.
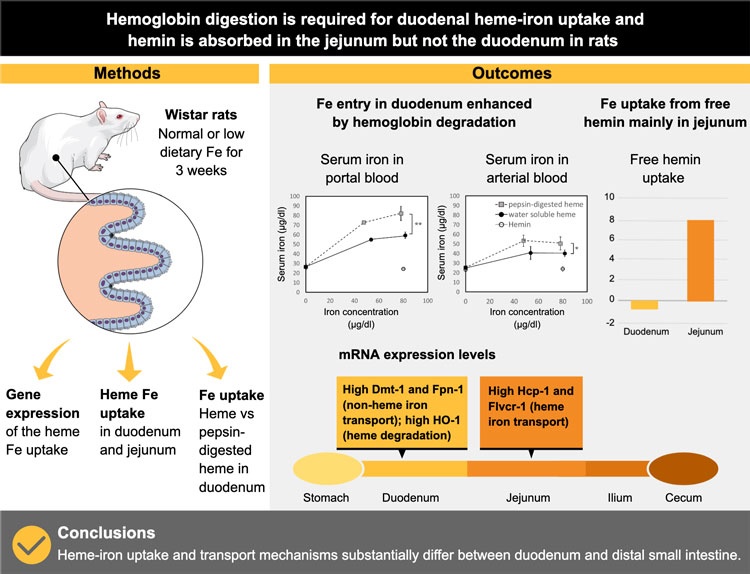
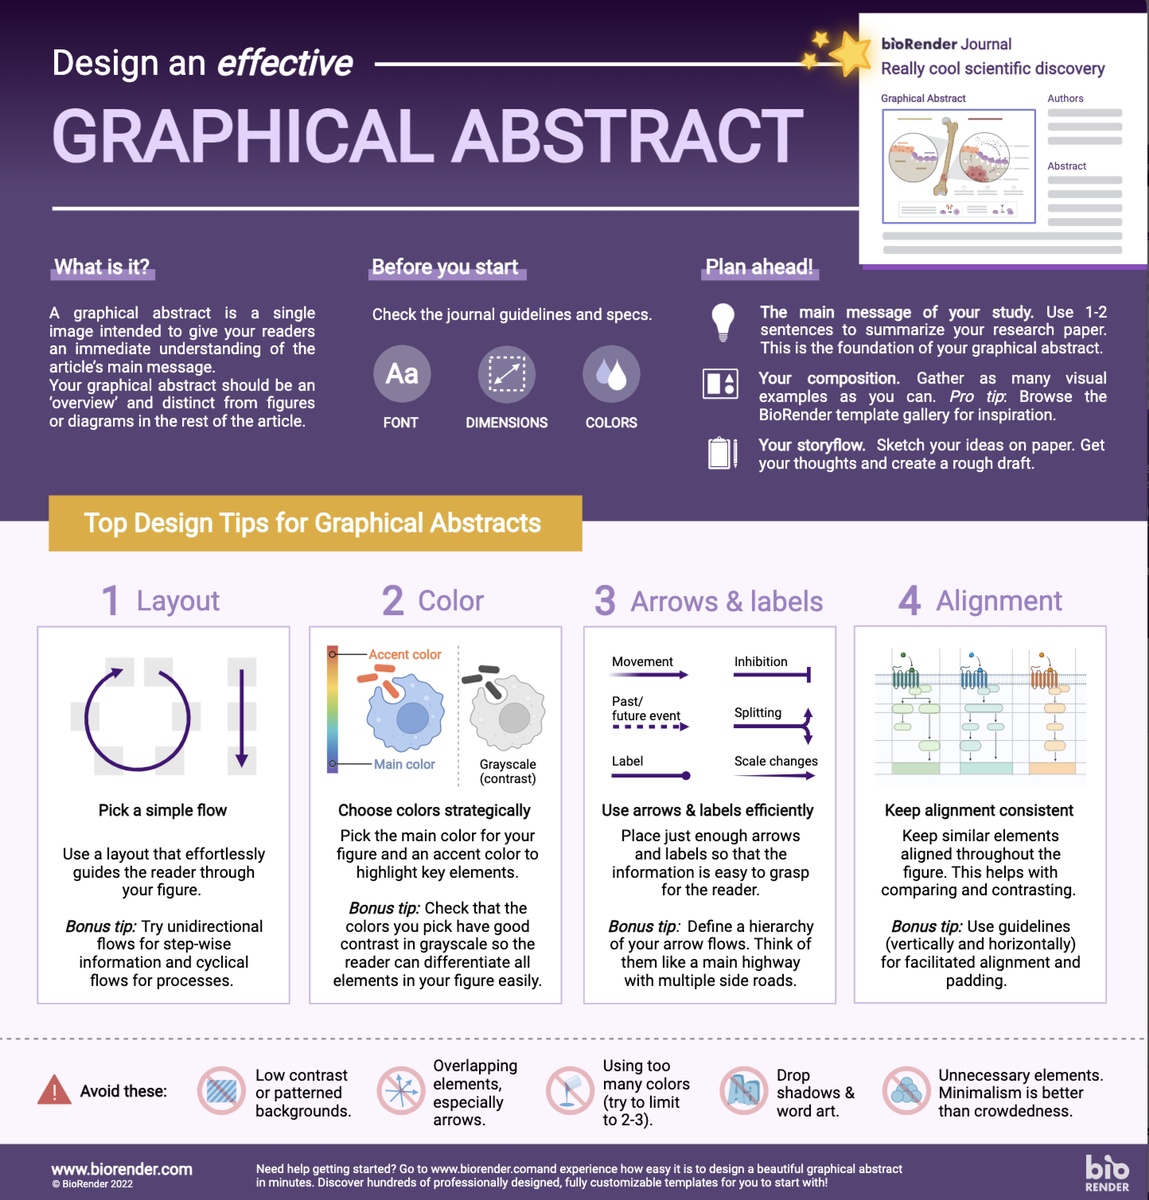
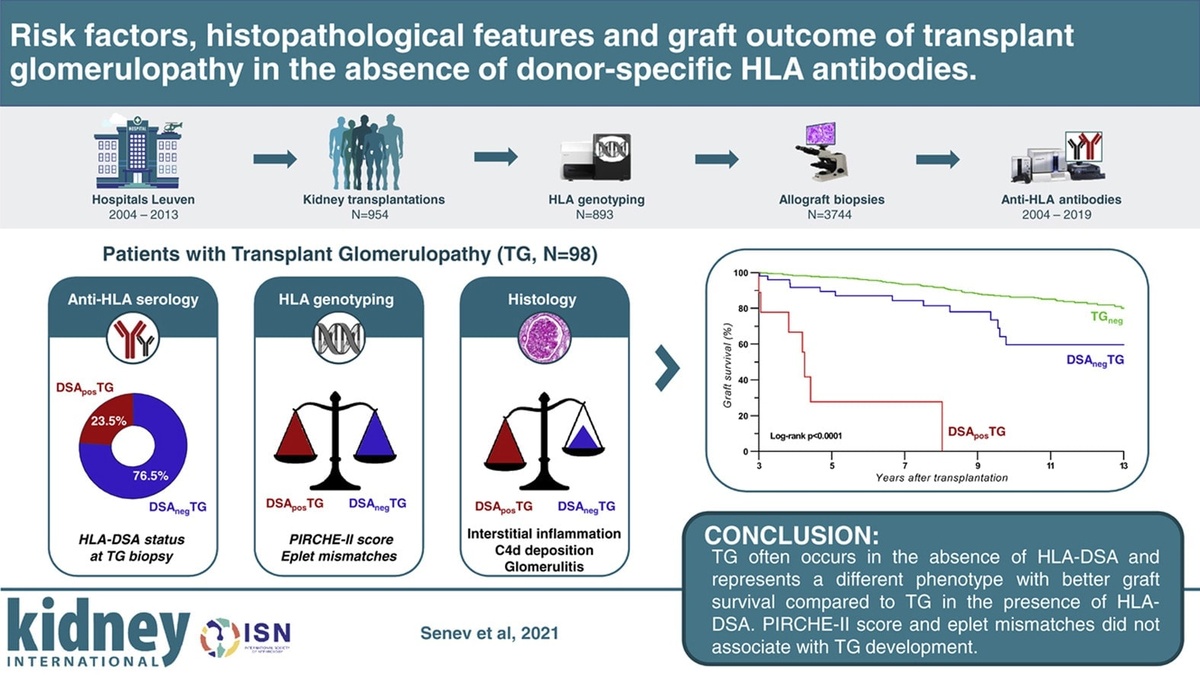
Real Examples of Graphical Abstracts from Published Papers
Which Journals Require a Graphical Abstract?
Not all journals require graphical abstracts, but the number that do is growing—especially among high-impact, interdisciplinary, or open-access journals. Here are examples of publishers and journals that commonly request or recommend graphical abstracts:
Elsevier: Many journals across disciplines (especially in chemistry, materials science, and life sciences) require graphical abstracts.
Springer Nature: Some journals like Nature Communications and Scientific Reports allow or encourage graphical abstracts.
Wiley: Several journals, particularly in chemistry and biology, require graphical abstracts for article promotion.
ACS (American Chemical Society): Journals like ACS Nano and Journal of the American Chemical Society require graphical abstracts.
Frontiers Journals: These open-access journals often use graphical abstracts as part of article promotion.
Check the “Guide for Authors” section of the specific journal to confirm if a graphical abstract is required and what its specifications are.
Benefits of Using a Graphical Abstract in a Research Paper
Even when not required, submitting a graphical abstract can provide several advantages:
1. Better Visibility and Engagement
Graphical abstracts are often featured on journal homepages, in article previews, and on social media. A strong visual can attract more clicks and shares, increasing your paper’s exposure.
2. Easier Communication
Complex ideas and results are easier to communicate when presented visually. This is especially useful when your paper reaches readers from different backgrounds or disciplines.
3. Improved Understanding
A well-designed visual helps readers quickly understand your study’s objective, methods, and main conclusion—making it more memorable.
4. Support for Multimedia Platforms
Many journals, research repositories, and universities now use graphical abstracts in email newsletters, conference posters, and science communication efforts.
Key Characteristics of a Good Graphical Abstract
Creating an effective graphical abstract takes more than just placing some diagrams into a box. Here are the essential elements:
Simplicity
Your graphical abstract should include only the most essential elements—avoid too much text, color, or complex diagrams.
Clarity
The visual must be easy to interpret. Use clear labels, consistent fonts, and straightforward illustrations.
Self-explanatory
The reader should understand the key idea without needing to read the full article.
Relevant Visuals
Use illustrations, icons, and diagrams that represent the methodology, findings, or impact of your research.
Size and Format
Most journals specify dimensions and resolution (e.g., 600 x 600 pixels, 300 dpi, JPG or TIFF format). Make sure your abstract meets these requirements.
Tools to Create Graphical Abstracts (and Their Features)
You don’t need to be a graphic designer to make a compelling graphical abstract. Several tools make the process accessible, even for beginners:
1. BioRender
Target Audience: Life sciences and biomedical researchers
Pros: Thousands of ready-made icons; intuitive drag-and-drop interface
Cons: Requires a subscription for high-resolution exports
Best For: Biology, medicine, neuroscience, and molecular graphics
2. Canva
Target Audience: General researchers, all fields
Pros: Free templates, customizable elements, easy to use
Cons: May require design adaptation for scientific accuracy
Best For: Social sciences, education, environmental science
3. Microsoft PowerPoint
Target Audience: Everyone
Pros: Familiar tool, flexible drawing features, no extra cost
Cons: Limited icons, needs manual design
Best For: Simple schematic diagrams or conceptual visuals
4. Adobe Illustrator
Target Audience: Advanced users, professional designers
Pros: Full creative control, vector-based design
Cons: Steep learning curve; expensive
Best For: Complex and customized abstracts in engineering and materials science
5. Mind the Graph
Target Audience: Scientific researchers
Pros: Pre-made scientific templates and visuals
Cons: Limited free version
Best For: Infographics and publication-ready visuals

Pro Tips for Creating Your First Graphical Abstract
Start with a sketch: Draw a rough layout on paper to organize your elements before going digital.
Use consistent fonts and colors: Stick to 2–3 colors and a readable font size.
Keep text minimal: Let visuals tell the story—use labels only where absolutely necessary.
Get feedback: Show your design to a colleague or supervisor for clarity and accuracy.
The graphical abstract is more than just a visual accessory—it’s a modern communication tool that enhances the impact of your research. Whether your target journal requires it or not, investing time into designing a clear, concise, and visually engaging summary of your work can significantly boost your article’s visibility, understanding, and citation potential.
By using the right tools and following best practices, you can create a compelling graphical abstract even without graphic design experience. As scientific publishing becomes more competitive and visual-driven, mastering the art of the graphical abstract could give your research the edge it deserves.
Create a Graphical Abstract with SITA Academy
Looking for a professional, creative, and accurate presentation of your research findings? The graphical abstract design service at SITA Academy is your trusted solution.
Our team of experienced scientific designers creates visuals that are acceptable for top-tier journals but also engaging.
![]()
Targeted design that follows international publishing standards
Fast visual communication of key concepts
Use of professional scientific icons and illustrations
Quick delivery, fair pricing, and full support until final approval
Verified Contact Channels
If you have any questions, inquiries, or would like to learn more about our services, please don't hesitate to reach out to us. Our dedicated team is ready to assist you.